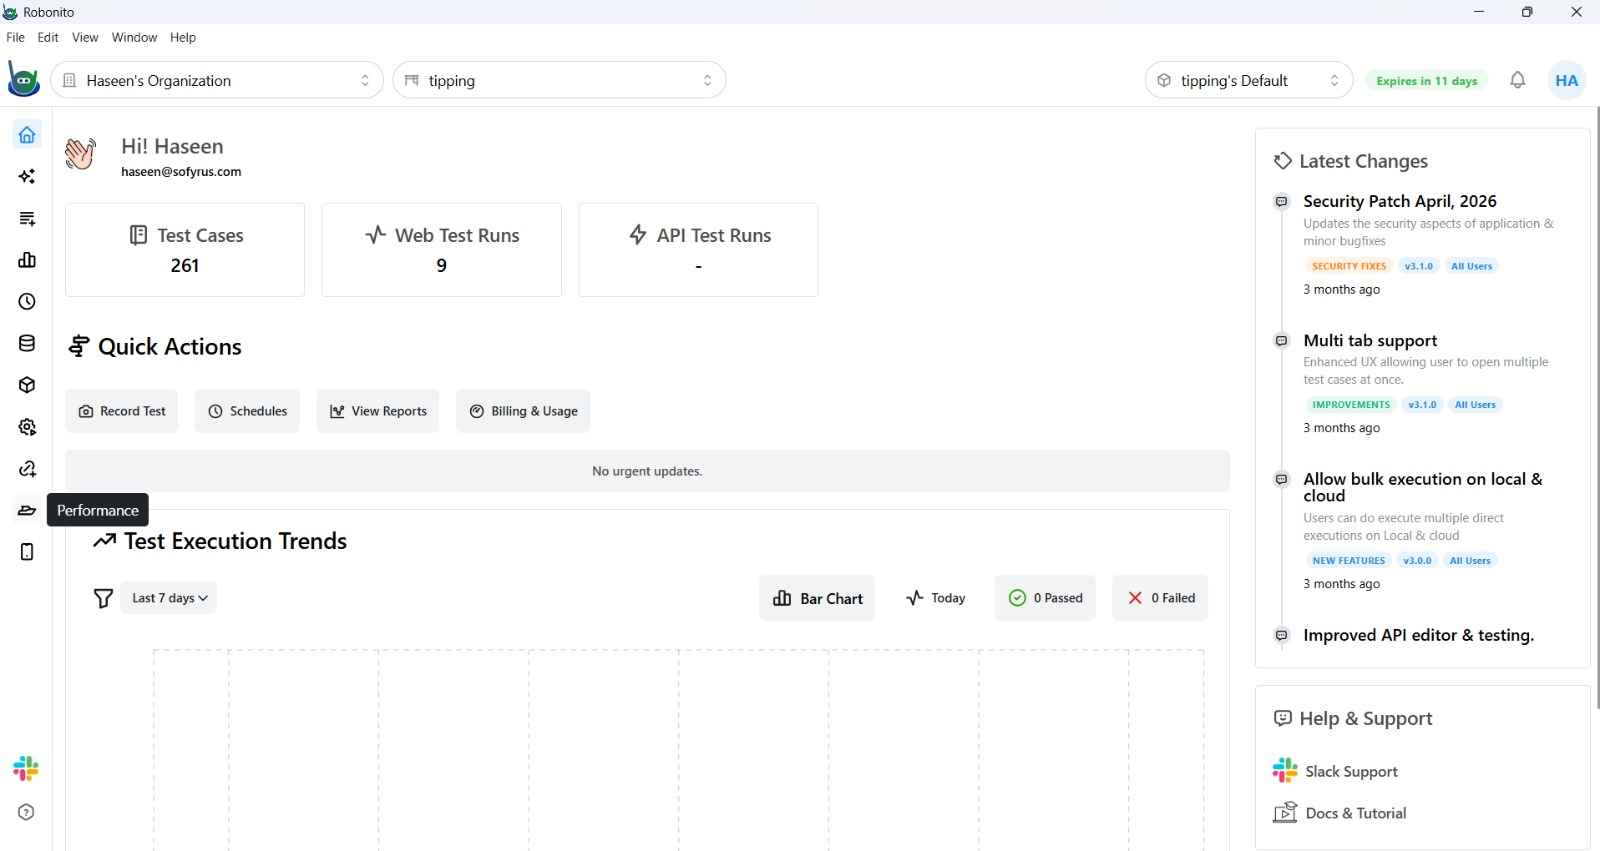
Performance Testing with Robonito
Robonito provides advanced performance testing capabilities that allow you to analyze how your application behaves under various conditions. By creating Load Profiles, you can simulate real-world user traffic and monitor system stability, response times, and resource usage.
Core Performance Modules
The Performance suite in Robonito consists of two primary tools:
1. Load Profile Editor
The Load Profile Editor is where you define the "shape" of your performance test. You can configure:
- User Load: How many concurrent virtual users should hit the application.
- Ramp-Up Time: How quickly the load should increase.
- Duration: How long the peak load should be sustained.
- Test Scenarios: Which recorded test cases or API endpoints should be executed as part of the load.
See also: Load Profile Configuration
2. Performance Monitor
The Performance Monitor provides real-time visualization of your application's health during an active test run. It tracks critical metrics such as:
- Response Latency: Time taken for the server to process requests.
- Success/Failure Rate: The percentage of requests that returned successfully.
- Throughput: Number of requests processed per second (RPS).
- System Resource Metrics: CPU and Memory utilization (when configured via agent).
Why Performance Test?
- Identify Bottlenecks: Find exactly which API endpoint or UI flow slows down under pressure.
- Verify Scalability: Ensure your infrastructure can handle peak traffic (e.g., during sales or marketing launches).
- Detect Memory Leaks: Observe if resource usage grows uncontrollably over long execution sessions.
- Benchmark Stability: Set a baseline for "normal" performance and ensure new code deployments don't regress.